Creating Accessible Iframes
Embedding iframes
Speaking on topic of web accessibility in context of embedded content, the main goal is to serve screen readers a hidden text content to describe visual content like charts or maps. Both charts and maps are usually embedded in web content using HTML iframes. Iframe is short term for inline frame used to embed another document within the current HTML document. This is the way to do that and corresponding example:
<iframe src="//viz.socialexplorer.com/projects/779ca389-0a59-4ac4-a0b4-cbf740882445&hiddenTitle=true" title="Testing iframe"></iframe>
Embedded iframe:
Visually, the page and embedded chart are completely functional and easy to use.
Screen readers and iframes
Screen readers are apps user primarily bz visually impaired persons. They provide audio representation of visual web content. Basically, they read the HTML document extracting text and parsing HTML tags in order to build structure to be voice synthesized. Some screen readers (like NVDA) provide the view of recognized site structure. Here is example showing a nicely structured webpage which is very easy to read by screen readers.
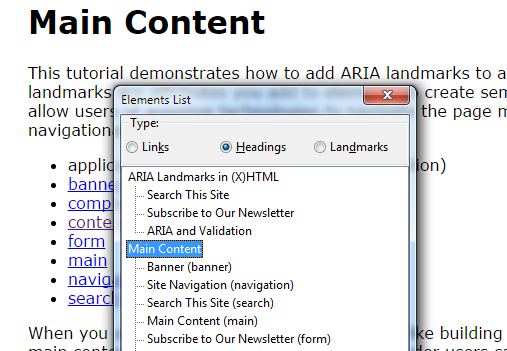
In this review we analyze this page You are reading, to explore how embedded content and generally iframe tag are recognized with their inner content.
VizWiz charts and alternative text
To test our VizWiz charts on web accessibility appliance, we made two examples of simple charts. The first one is classic chart with no content provided for screen readers and the second one having hidden description of chart that is easily recognized by screen readers. Here are links to these separate visualizations to be opened in separate tabs/windows:
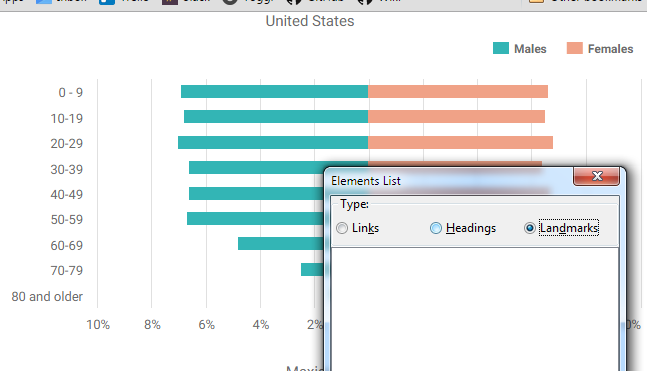
Example 1: VizWiz charts without alternative text
If we explore the first chart/page using Elements list explorer in NVDA screen reader, we don't see any landmarks or other elements to be interpreted. Therefore, as it could be expected, this chart is no useful for visual impaired persons.
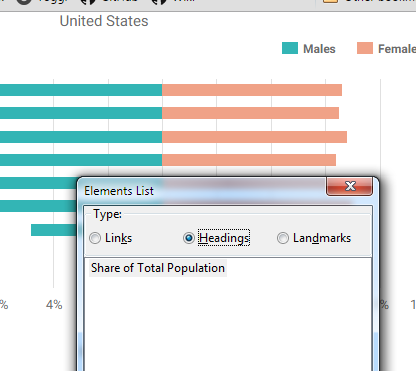
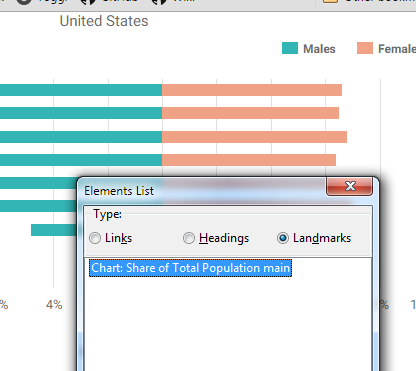
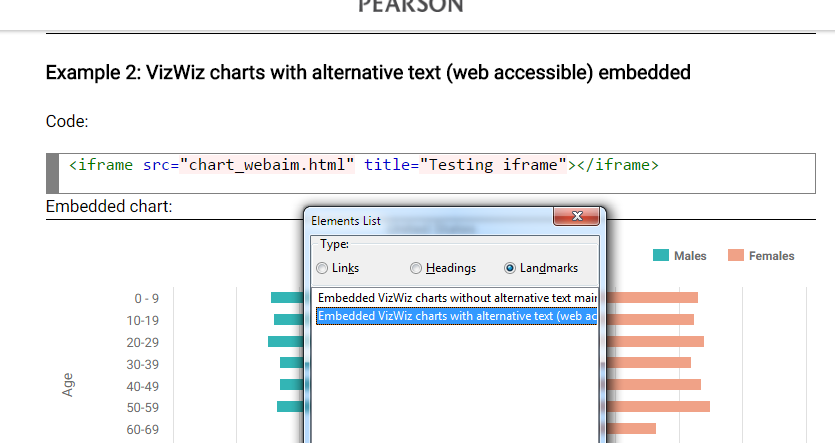
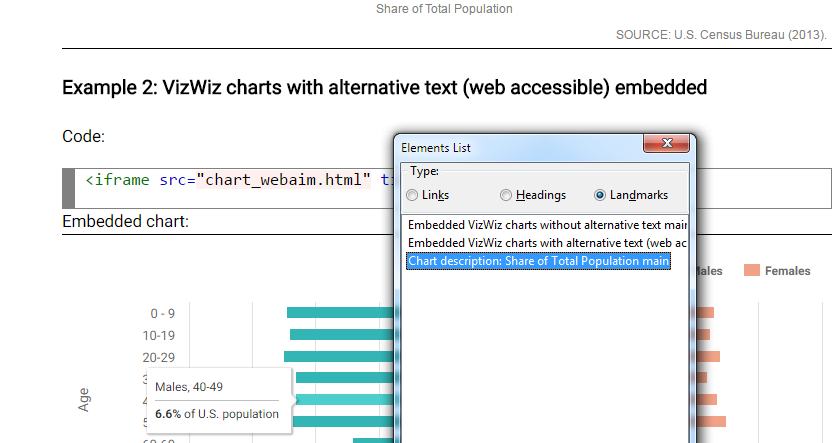
Example 2: VizWiz charts with alternative text (web accessible)
However, exploring the second chart/page using NVDA screen reader, we can see landmarks and headings recognized. Therefore, this chart is web accessible even though it looks completely the same
Comparing source code of these two charts, we can see hidden block of text and the simple use of WAI Aria tag properties for screen user interpretation.
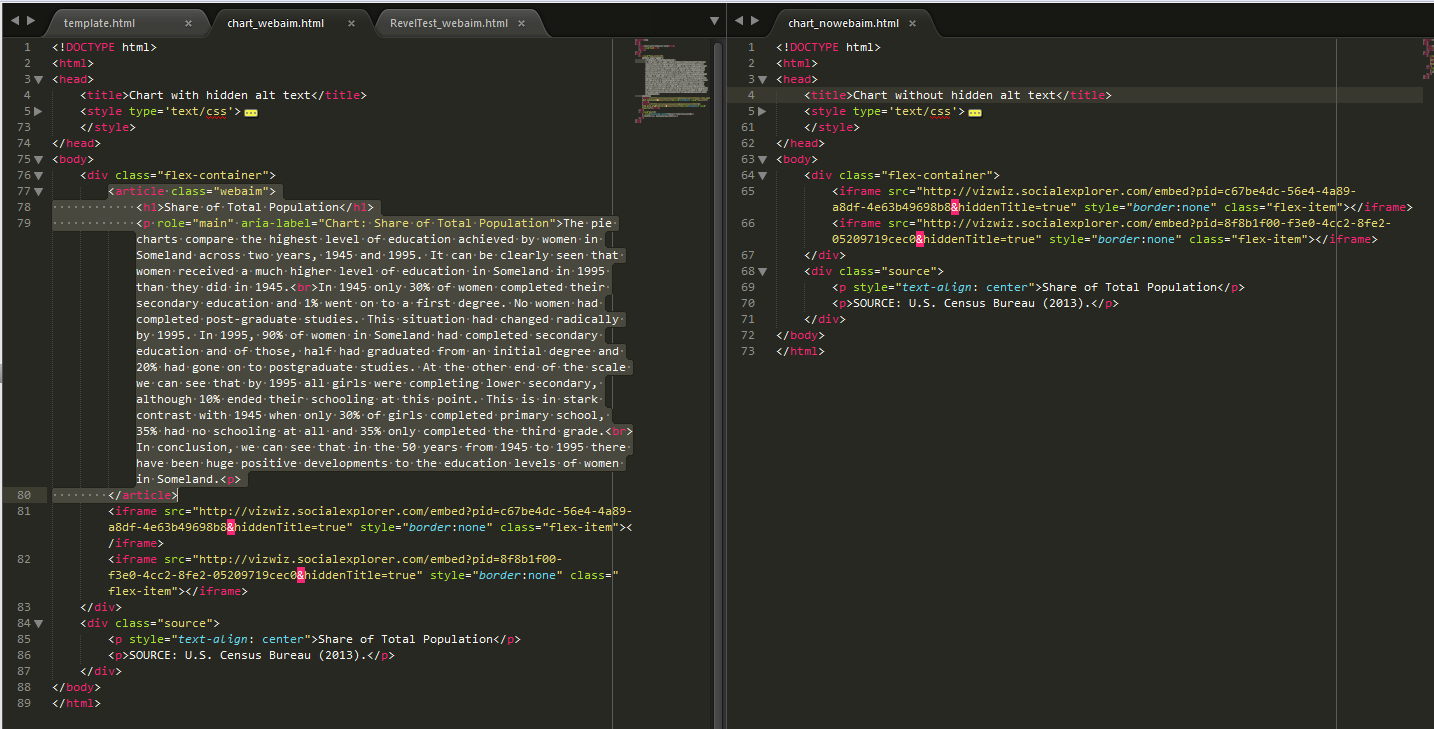
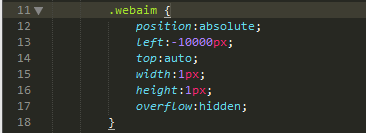
Hidden content is styled using suggested method compatible with most of screen readers:
VizWiz charts embedded in eBooks
Now we take a look at the same two examples, but this time embedded into this web page using standard method (iframe)
Example 1: VizWiz charts without alternative text embedded
Code:
<iframe src="//viz.socialexplorer.com/projects/779ca389-0a59-4ac4-a0b4-cbf740882445&hiddenTitle=true" title="Testing iframe"></iframe>
Embedded chart:
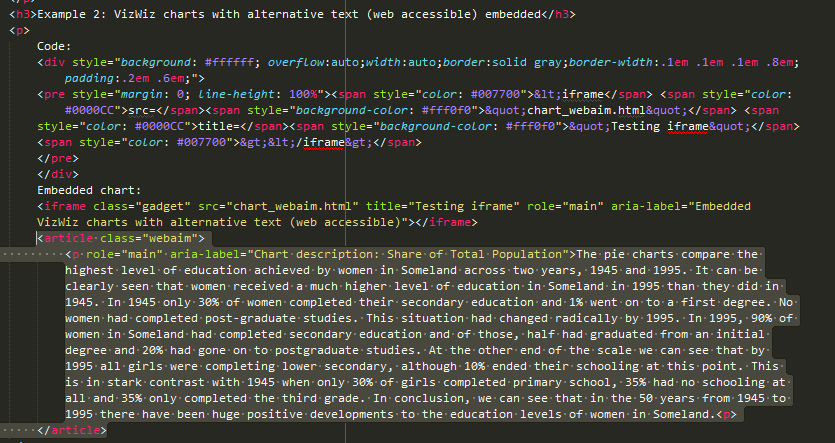
Example 2: VizWiz charts with alternative text (web accessible) embedded
Code:
<iframe src="//viz.socialexplorer.com/projects/779ca389-0a59-4ac4-a0b4-cbf740882445-webaim&hiddenTitle=true" title="Testing iframe" role="main" aria-label="Embedded VizWiz charts with alternative text (web accessible)"></iframe>
Embedded chart:
The pie charts compare the highest level of education achieved by women in Someland across two years, 1945 and 1995. It can be clearly seen that women received a much higher level of education in Someland in 1995 than they did in 1945. In 1945 only 30% of women completed their secondary education and 1% went on to a first degree. No women had completed post-graduate studies. This situation had changed radically by 1995. In 1995, 90% of women in Someland had completed secondary education and of those, half had graduated from an initial degree and 20% had gone on to postgraduate studies. At the other end of the scale we can see that by 1995 all girls were completing lower secondary, although 10% ended their schooling at this point. This is in stark contrast with 1945 when only 30% of girls completed primary school, 35% had no schooling at all and 35% only completed the third grade. In conclusion, we can see that in the 50 years from 1945 to 1995 there have been huge positive developments to the education levels of women in Someland.
Screen readers examples comparison
If we analyze how screen readers see these two examples, we can see that iframe element is visible (because of usig WAI Aria tag role and label properties). However, content inside of iframe is not recognized neither in first or second example
Possible solution
Considering what we have seen here, we can suggest currently only one solution: alternative text (charts and maps descriptions) to be inserted with/after the iframe tags as a code example below:
Alternative description text provided in this way is fully recognized by screen readers and therefor good solution to try
NOTE: Description text is dummy and completely unrelated to the test charts